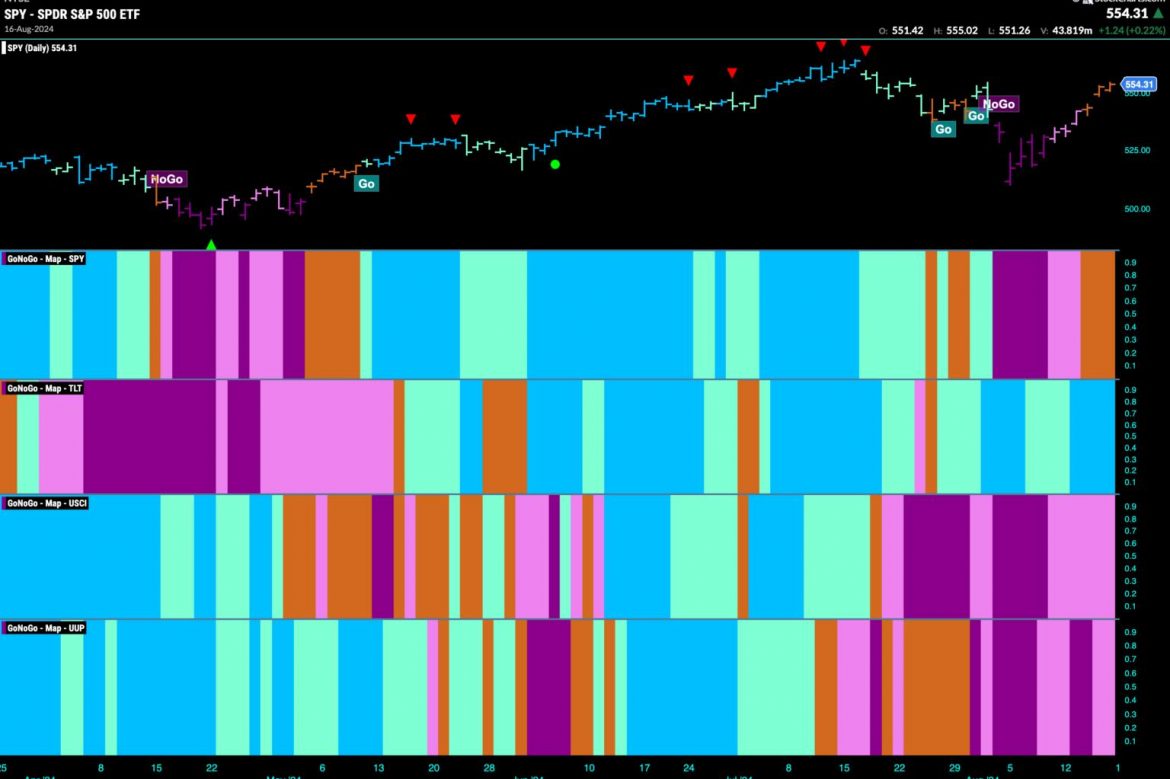
Good morning and welcome to this week’s Flight Path. Equities continue their path out of the “NoGo” correction. This week we saw amber “Go Fish” bars over the second half of the week. GoNoGo Trend shows that the trend in treasury bond prices saw strength with strong blue bars. U.S. Commodities index remained in the “NoGo” trend but continue to show weakness. The dollar as well, saw weak pink “NoGo” bars at the end of the week.
$SPY Rallies and Indicator Paints “Go Fish” Bars
On Thursday, price gapped higher and GoNoGo Trend painted more “Go Fish” bars as the week came to a close. There was much enthusiasm this week and we are fast approaching an interim high. GoNoGo Oscillator has broken away from the zero line and out of a small GoNoGo Squeeze into positive territory. With positive momentum, we will watch to see if this gives price the push it needs to enter a new “Go” trend.
The longer time frame chart tells us that the “Go” trend is still safe for now. The week’s strong rally pushed price higher and away from last week’s lows. We look at the oscillator panel and see that GoNoGo Oscillator tested the zero level for only a bar or two, and was quickly able to find support and bounce back into positive territory. Now we can say that momentum is resurgent in the direction of the underlying “Go” trend and we will look to see if price can climb further from here.
Treasury Remain Suppressed
While there was no new lower low this week, the “NoGo” trend remained in place. We can see that price is painting pink “NoGo” bars, higher than the recent low and lower than the recent high. If we look at the oscillator panel, we can see that GoNoGo Oscillator is testing the zero line from below again. We will watch to see if it finds resistance at this level as it has now for several weeks.
he weekly chart below shows us that the trend remains strongly “NoGo”. This is the second strong purple bar in a row and we can say that there is downside pressure on prices with the weight of the evidence approach. GoNoGo Oscillator is in negative territory but no longer oversold at a value of -3.
The Dollar’s “NoGo” Weakens but Remains
It was an up and down week for the dollar. It fell early in the week then gapped higher before falling again on Friday. We saw GoNoGo Trend move between pink and purple “NoGo” bars. When price gapped higher it was not able to set a new high and as prices fell again on Friday we saw a NoGo Trend Continuation Icon (red circle). GoNoGo Oscillator has been rejected again by the zero line and so we know that momentum is in the direction of the “NoGo” trend.